My love of hackathons and spatiotemporal research came together during the weekend of MakeOHI/O 2016: OSU’s hardware-focused hackathon.
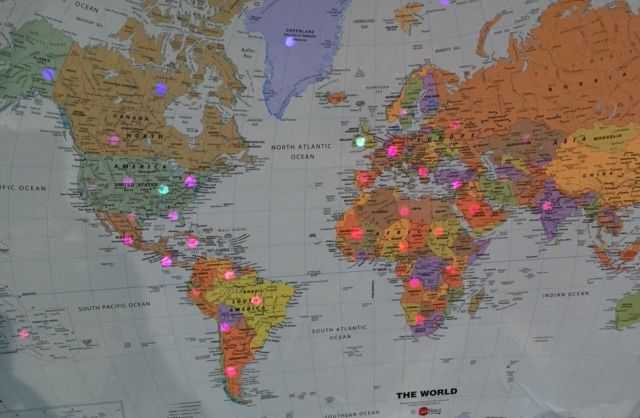
This world map poster connected to your computer via USB and allowed you to visualize weather and network traffic using LEDs to illuminate regions.
Looking back, this is the college hack I’m most proud of. It required a strong hardware piece as well as software – creatively combined the two – and came together in just 24 hours.
The Software
The map’s LEDs were driven by an Arduino Mega and the rest of the project was coded in Python.
While my teammates began wiring the map, my first software objective was controlling the LEDs. C/C++ is efficient but isn’t ideal in rapid-prototyping environments like a hackathon. Hence, my goal was to offload the controller logic to Python in as few lines of code as possible:
#include <Adafruit_NeoPixel.h>

#define SET_ALL_LEDS_COMMAND 0
#define SET_SPECIFIC_LED_COMMAND 1

Adafruit_NeoPixel strip = Adafruit_NeoPixel(
  60, // Number of pixels in strip
  6, // The pin number where the strip is connected
  NEO_GRB + NEO_KHZ800 // Flags specific to your NeoPixel product
);

void setup() {
  Serial.begin(9600); // Initialize serial communications
  strip.begin();  // Initialize NeoPixel strip
  strip.show(); // Initialize all pixels to 'off'
}

void loop() {
  if (Serial.available() >= 1) {
    int command = Serial.read();

    int red = Serial.read();
    int blue = Serial.read();
    int green = Serial.read();

    int pos = 0;
    if (command == SET_SPECIFIC_LED_COMMAND) {
      pos = Serial.read();
      strip.setPixelColor(pos, strip.Color(red,blue,green));
    } else {
      for (int i = 0; i < NUMBER_OF_PIXELS_IN_STRIP; i++) {
        strip.setPixelColor(i, strip.Color(red,blue,green));
      }
    }

    strip.show();
  }
}
This very basic serial protocol updated the light strip when it received 4 bytes (command type + red, blue, green) over the USB connection (the optional 5th “address” byte to only update a specific LED).
In Python, a CSV file is loaded that mapped each (latitude, longitude) to an LED address (an index from the first LED starting at 0):
with open("mappings.csv") as csvfile:
    reader = csv.DictReader(csvfile)
    coord_to_led_address = {(r["lat"], r["long"]): r["address"] for r in reader}
Quick proof-of-concept: OpenWeatherMap’s API allows lookups by lat-long. I grabbed the current weather for each coordinate, normalized the temperatures to [0, 255] and colored each region from blue (coldest) to red (hottest).
Real-time, global visualization of network traffic is an intriguing application of this technology. Cybersecurity analysts and efficiency engineers might use a visualization tool like this to improve routing and easily spot nefarious communications.
One approach is to capture inbound/outbound packets and read the IP address using Wireshark (via PyShark). That’s what I did at the time; in retrospect, it’s a bit overkill. A simpler approach would have been to monitor active TCP/UDP connections using netstat.
Once the script started collecting remote IP addresses, I built a lookup table in Python using a IP geolocation API called ipstack. Caching and persistence (ex. using pickle) were crucial to limit API calls since most lookups were repetitive.
I took the resulting lat-long and used our coord_to_led_address mapping to color the LED nearest IP address. To make the map more timely and animated, I used a timer to slightly bump the brightness before slowly fading it back to off. Then high-traffic connections like streaming video were indicated by a bright LED that stayed lit for the duration of the communication.
This was a good start but the queue holding the packets for IP geolocation became overwhelmed and lagged behind after a few minutes of runtime. To mitigate this, I sampled the packets collected and invalidated any queued samples that were older than 30 seconds.
The Hardware
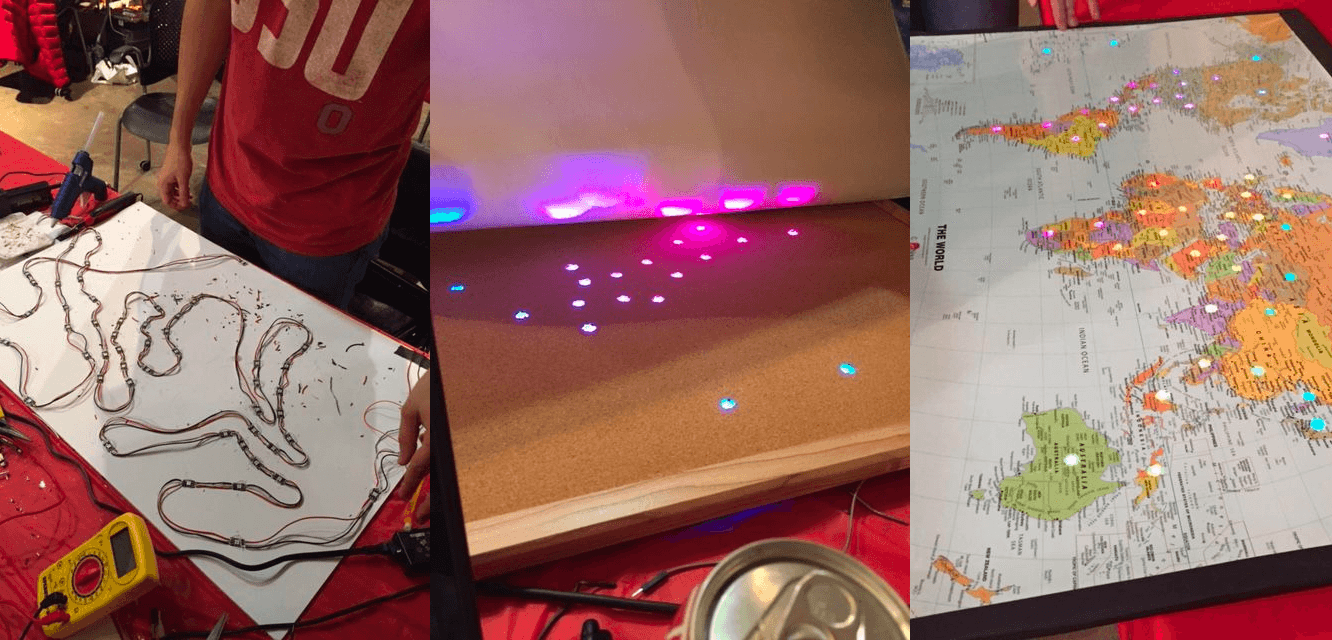
LED matrices are complex - building one from scratch could constitute a hackathon project itself. For this project, we used NeoPixels. They’re great for these types of projects and come with an easy-to-use Arduino library.
Our local Microcenter only had two strips of 30 left, so we had to break them down into individual lights. Then, we spent hours with a glue gun and soldering iron affixing all 55 to the baseboard (we burned 5).
More Info
This project was built by Dalton Flanagan, Brandon Lundeen, and Jeff Ivey during Ohio State’s 2016 MakeOHI/O. It was awarded 4th overall, Best Lighting Project and was featured in The Columbus Dispatch. Click here to learn more about OSU’s hackathon program and consider a donation.