What if you could invest in emojis? We decided to find out at Boilermake 2017.
The Idea
In January 2017, emojis were vernacular. Robinhood was gaining popularity.
Publicly traded securities and their valuations are complex. What if there was an easier way to learn to trade using something more familiar and novel - like emojis?
Emoji prices would fluctuate based on how often they were being used on social media. The concept was simple: invest in 🎉 before New Year’s Eve and get rich.
Validation
We first needed to validate that basing price data off Twitter would result in meaningful price shifts.
The presidential inauguration took place that weekend, so we backfilled data for Tweets containing the US flag emoji (🇺🇸), took the derivative, applied a Savitzky–Golay filter, and piped that into matplotlib:
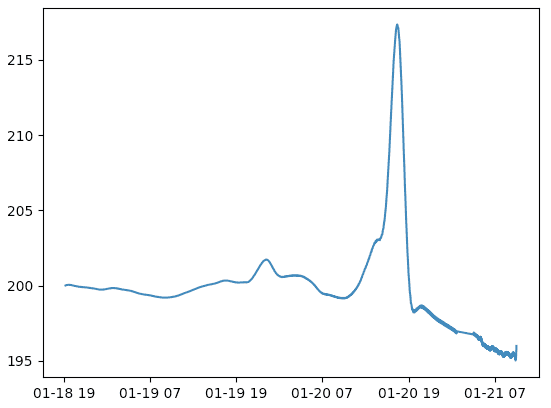 The “price” over time for US flag emoji (🇺🇸) around the inauguration at 9am Jan 20
Boom - this could work!
Data Pipeline
We used Matthew Rothenberg’s Emojitracker to monitor, for each emoji, the total count of Tweets containing that character at a given time.
We valued the most popular emoji, tears of joy (😂), at $500.00. All other emojis had an initial price set based on their popularity relative to that.
We needed a pricing algorithm that reflected how a market would reasonably react to changes in volume. For this, we used a central difference formula to calculate a backward-biased new price every minute in a scheduled job.
To simulate “other traders” on the market, we used random to add some noise into the pricing formula.
Web Interface
We tried to keep the web stack simple. Our backend and data pipeline were built using Python, MySQL, and Tornado. We built a single-page frontend using Vue.js.
To connect the frontend graph visualization and the pricing database, we used Tornado to set up an API with a single charts endpoint.
When the Vue.js app calls this endpoint for a particular emoji, the server fetches the last n price-and-timestamp pairs via SQL. It then preprocesses these pairs into time windows (all time, 1 day, 1 hour, 30 min) and returns results in JSON.
Next
Our 36-hour prototype turned out to be enough, but given more time, here’s how we’d improve it:
- Implement user accounts with buy and sell functionality so users can track their portfolios over time. This turned out to be too time-consuming for the hackathon, so we leaned heavier on the data science and visualization instead.
- Make emoji valuations interdependent on each other to simulate market-wide rises and falls.
- Create index funds for related emojis (ex. $FACE includes 😃, 😊, 😲; $HEART includes 💛💙💜💚).
More Info
This project was built by Dalton Flanagan, Mike Letscher, Brandon Lundeen during Purdue’s Boilermake 2017 hackathon. It won 2nd place.
The frontend source code is available on GitHub.